|

January 02, 2024
By Zachary Shahan
21 Gigawatts of US Coal to Retire in
Next 3 Years, 88–211 Gigawatts of Solar to Join Grid

I just wrapped up reports on new
power capacity in the United States and electricity
generation in the United States. Clearly,
the trend is toward more renewables and less coal. Aside from showing
power capacity additions from month to month by energy source, the
Federal Energy Regulatory Commission (FERC) includes a section in its
monthly reports that shows expected power capacity retirements in the
coming 3 years. It’s a fascinating forecast to look at.
First, though, let’s set the stage
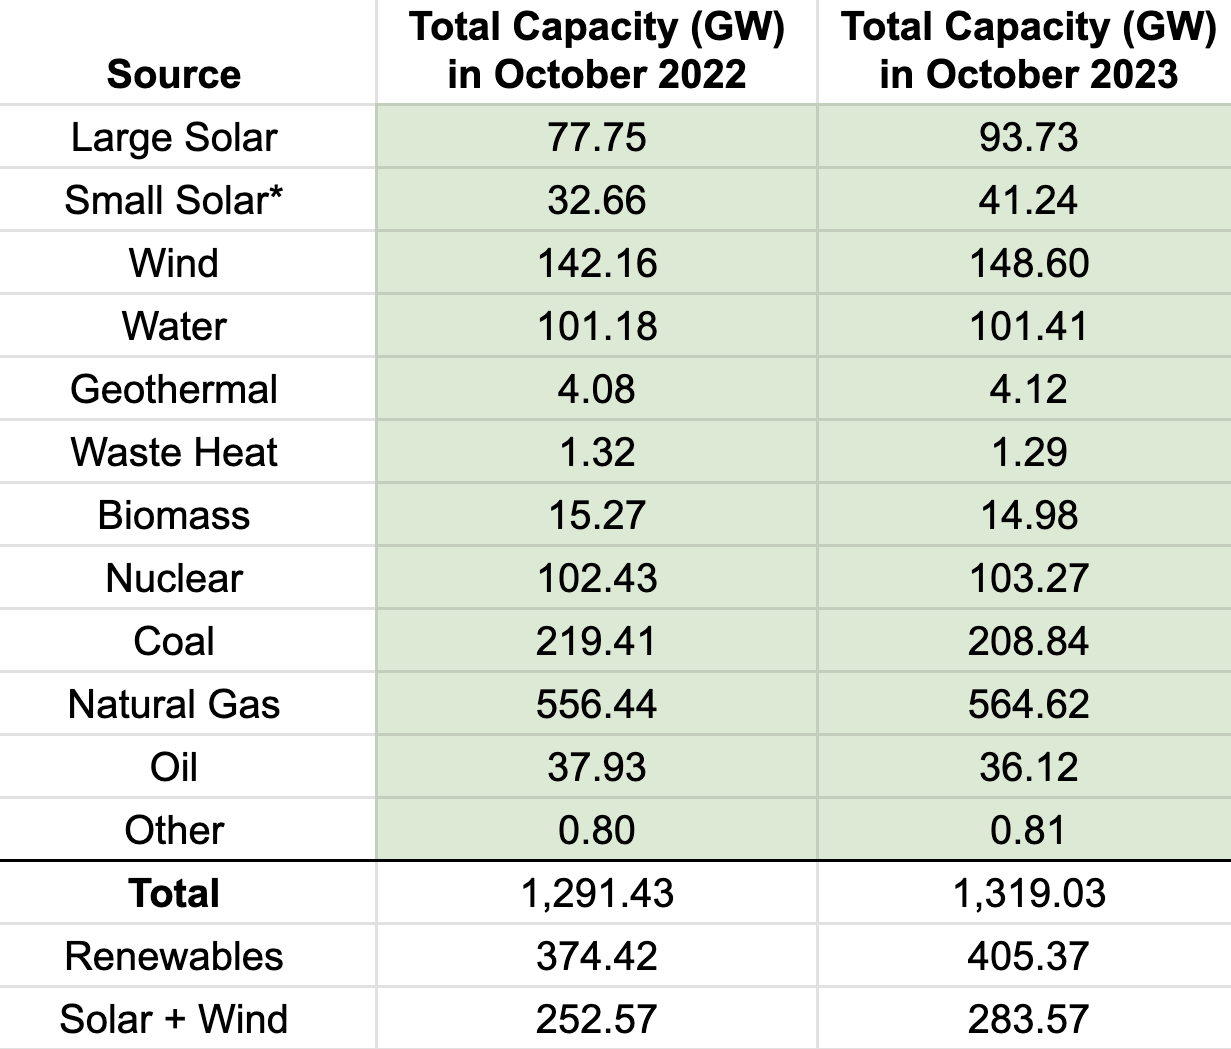
for total installed power capacity in the United States. Renewable
energy sources have risen to about 30.7% of total installed power
capacity across the country in October 2023, based on FERC data and a CleanTechnica estimate
for small-scale solar. That’s up from 29% of total installed power
capacity across the country in October 2022. Solar power now accounts
for about 10.2% of US power capacity, and wind power accounts for
another 11.3%. Hydropower accounts for about 7.7%, while nuclear power
accounts for 7.8%.
The big dog, fossil gas (aka “natural gas”),
accounts for about 42.8% of US power capacity, down from 43.1% in
October 2022. The former big dog, coal, is down to 15.8%, compared to
17% in October 2022. But let’s look back a bit further on coal and
also look forward a few years.
Coal accounted for 30.4%
of US power capacity back in 2010, and then
19.7% in 2020. Being down to 15.8% in October 2023, it looks like we
will see an even more significant drop in coal’s share of the power
capacity market in this decade. It looks like coal will be below 10%
of the market by 2030.
And here’s the real clincher: Look at FERC’s
forecast for new power capacity additions and expected retirements
(below).
Wind power capacity is
forecasted to grow by 20
GW to 62
GW, while net change in fossil
gas power capacity is expected to be
somewhere between 2
GW and 12
GW.
And all of that is just the forecast for the next 3 years.
Hello, sunshine! The 2020s is looking to be another great decade for
the transition to clean renewable energy.
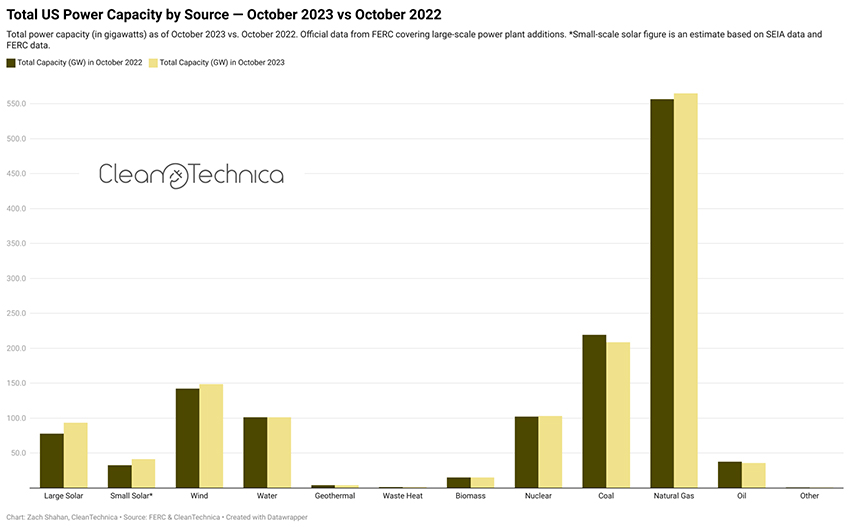
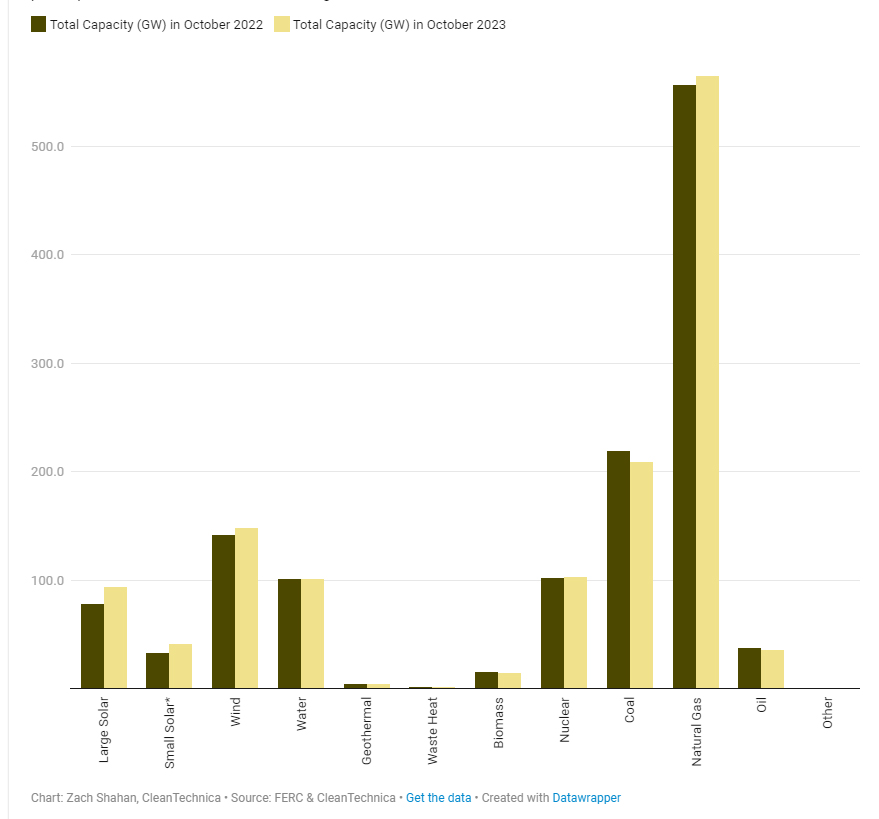
Total US Power Capacity by Source — October 2023 vs
October 2022
Total power capacity (in gigawatts) as of October 2023 vs. October
2022. Official data from FERC covering large-scale power plant
additions. *Small-scale solar figure is an estimate based on SEIA data
and FERC data.
Green Play Ammonia™, Yielder® NFuel Energy.
Spokane, Washington. 99212
509 995 1879
Cell, Pacific Time Zone.
General office:
509-254
6854
4501 East Trent
Ave.
Spokane, WA 99212
|