|
Return To Main Page
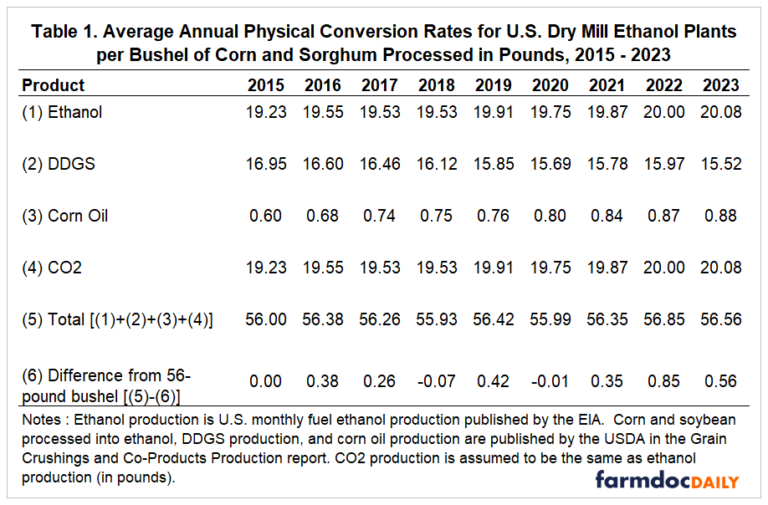
CO2 Production by the U.S. Ethanol Industry and the Potential Value of Sequestration There has long been an interest in the role of biofuels in ōdecarbonizingö the transportation sector in the U.S. An issue that has been receiving a great deal of attention lately is the potential for ethanol plants to lower their carbon footprint by sequestering CO2 that is generated by the ethanol production process. For example, several efforts are underway to construct pipelines to transport CO2 from ethanol plants to areas with suitable geologic formations for sequestration, a process that has not been without controversy (e.g., Douglas, 2022). Sequestration projects have been spurred by incentives included in the Inflation Reduction Act (IRA) passed by the U.S. Congress in 2022 and signed into law by President Biden. The purpose of this article is to estimate the total CO2 produced by the U.S. ethanol industry and the potential value to the industry of earning tax credits for sequestration. AnalysisSince we are not aware of an official data series in the public domain on the total CO2 production of U.S. ethanol plants, it must be estimated. We do so by making use of our recent analysis of the operational efficiency of U.S. ethanol plants (farmdoc daily February 9, 2024). Four measures of efficiency were presented in that article. Table 1 presents annual averages of the four measures for 2015 through 2023. The first operational efficiency measure that we computed is gallons of ethanol produced per bushel of feedstock processed. We computed this measure by dividing monthly fuel ethanol production from the EIA by the bushels of corn and sorghum feedstock used at U.S. dry mill ethanol plants from the USDAÆs monthly Grain Crushings and Co-Products Production report. One change from our earlier article is that the ethanol conversion rate is shown in pounds per bushel of corn processed rather than gallons, to use the same units for all four measures. We assume that, on average, a gallon of 190 proof ethanol weighs 6.8 pounds. Slightly different weights could be assumed based on the assumed proof of the ethanol and temperature. Ethanol production is estimated to have increased from 19.23 pounds per bushel processed in 2015 to 20.08 pounds in 2023, a net gain of 0.85 pounds.
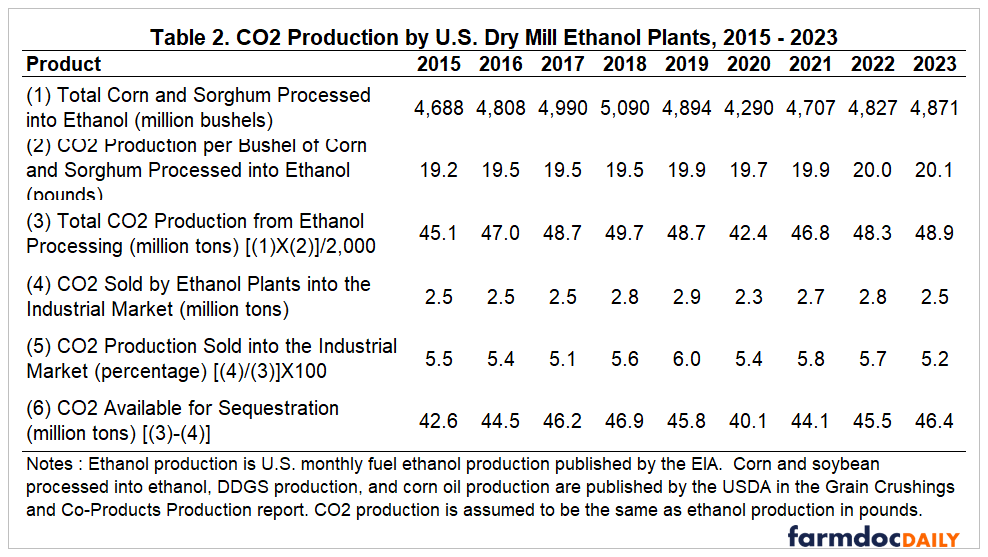
The second operational efficiency measure that we computed is pounds of dried distillers grain with solubles (DDGS) produced per bushel of feedstock processed, and the third is pounds of corn oil produced per bushel. These two conversion rates were also computed using data from the monthly Grain Crushings and Co-Products Production report. See the February 9th article for complete details on the computation of each of these two measures. As shown in Table 1, DDGS production is estimated to have fallen from 16.95 pounds per bushel processed in 2015 to 15.52 pounds in 2023, a net loss of 1.43 pounds. Corn oil production is estimated to have risen from 0.60 pounds per bushel processed in 2015 to 0.88 pounds in 2023, a net gain of 0.29 pounds. The fourth operational efficiency measure that we computed is pounds of CO2 produced per bushel of feedstock processed. In our February 9th article, the measure was based on CO2 production as reported in the monthly Grain Crushings and Co-Products Production report. The volume in the report can be more accurately described as the amount of CO2 sold into the industrial marketplace by ethanol plants, and it is not necessarily indicative of the total amount of CO2 produced. It is well known that roughly equal amounts of ethanol and CO2 by weight are produced in the fermentation process of ethanol production (e.g., Mosier and Ileleji, 2006). Therefore, we assume here that equal amounts of ethanol and CO2 are produced per bushel of feedstock processed. By construction, then, the trends in ethanol and CO2 produced per bushel of feedstock shown in Table 1 are identical. The bottom two rows of Table 1 provide a check on the assumption of equal amounts of ethanol and CO2 per bushel of feedstock processed. The next to the last row (5) sums the estimated weights of the four products for each year over 2015 through 2023. The last row (6) is the difference between the total estimated weights and the standard weight of a bushel of cornŚ56 pounds. The differences are very small, ranging from -0.07 to +0.85 pounds, and average only 0.30 pounds. The average is only about one-half of one percent of a 56-pound bushel. The implication is that our assumption of equal amounts of ethanol and CO2 production matches quite nicely with the prediction of the basic chemistry of fermentation. In sum, this assumption combined with the estimated conversion rates for ethanol, DDGS, and corn oil provides a full accounting for the corn and sorghum feedstock used in ethanol processing during this time period. We now have the building blocks to estimate the total CO2 production of U.S. ethanol plants. The specific steps are presented in Table 2. The first row shows the total bushels of corn and sorghum feedstock processed into ethanol over 2015 through 2023, based on the USDA Grain Crushings and Co-Products Production report. Total bushels have grown relatively little over time. The second row presents the CO2 conversion rates from the fourth row of Table 1. Multiplying total feedstock by the CO2 conversion rate provides an estimate of the total CO2 produced by ethanol plants in million tons. Total estimated CO2 production varies between 42.4 million tons in the pandemic year of 2020 and 48.9 million tons in 2023. The fourth row shows CO2 sold into the industrial marketplace according to the USDA Crushings report. The small size of this usage is highlighted in the fifth row, which computes the percentage of total production represented by industrial sales. The average is a bit more than five percent per year. Hence, the vast majority of CO2 production of ethanol plants in the U.S. is released at the plant and potentially available for sequestration.
It is hard to assess the magnitude of CO2
production by U.S. ethanol plants without some frame of reference. To
simplify matters, consider the average CO2 available for sequestration
over 2015 through 2023 of 44.7 million tons. Since this is based only
on dry mill plants, we multiply 44.7 by 1.09 to estimate that 48.7
million tons of CO2 is available, on average, for sequestration from
both dry and wet mill ethanol plants. As part of their
inventory of U.S. greenhouse gas emissions, the U.S. Environmental
Protection Agency (EPA) estimates that 6,048 million tons of CO2
equivalent emissions occurred in 2022. Using this as a benchmark, the
total CO2 production of ethanol plants available for sequestration
represents slightly less than one percent of total U.S. CO2 equivalent
emissions. This helps put into perspective the large size of CO2
production from the relatively small number of ethanol plants operating
in the U.S. It is important to note that total CO2 production estimated
here does not necessarily imply a high carbon intensity score (CI) for
ethanol as a fuel. This is a complex calculation that accounts for
carbon emissions from the feedstock production level through to the
tailpipe of engines that burn the ethanol.
The next question to consider is the potential value of sequestered CO2 to the U.S. ethanol industry. We focus in this article on the direct benefits from the ō45Q ō federal tax credit. This credit was first established in 2008 to incentivize the use of carbon capture and sequestration technologies to reduce CO2 emissions from fossil fuel power plants and other large industrial sources (Jones and Marples, 2023). The CO2 is captured at the point of emissions and then permanently sequestered by injecting it into underground saline formations. The dollar amount of the 45Q credit and provisions have been changed several times since 2008, most recently in the Inflation Reduction Act (IRA) of 2022. Starting in 2023, the IRA increased the 45Q credit to $85 per metric ton of CO2 that is geologically sequestered, among other revisions. The credit is equivalent to $77 per 2,000-pound ton. It is straightforward to compute the maximum possible benefit to the U.S. ethanol industry from the 45Q credit. Simply multiply the earlier estimate of 48.7 million tons of CO2 by $77 per ton, which equals $3.75 billion of additional revenue per year (after-tax). We recently estimated the total (pre-tax) income of U.S. ethanol producers in 2023 to be $4.5 billion (farmdoc daily, February 12, 2024) without consideration of the 45Q credit. While an exact figure cannot be computed, it is safe to conclude that the maximum revenue from the 45Q tax credit would more than double the after-tax income of ethanol producers. This is a very large potential impact by any reasonable standard. The analysis to this point has not considered the cost of sequestration. Most ethanol plants are located in Corn Belt locations without local access to the required geologic saline formations for injection (Sanchez, et. al, 2018). Hence, CO2 from many ethanol plants would have to be transported by pipeline to locations with the required geologic formations. Ethanol producers would either have to invest large amounts of capital in building the pipelines themselves or pay pipeline operators for access. In addition, there are equipment costs to capture CO2 at the ethanol plant and costs of operating the capture equipment. Finally, many ethanol plants will not generate enough income to offset all of 45Q credits they can potentially generate, and would have to sell excess credits in a new secondary market for credits that was created by the IRA. Buyers in the secondary market would likely demand some kind of discount for the transaction. It is very hard to estimate the total cost of implementing CO2 sequestration at the present time, and the cost is likely to vary substantially across ethanol plants. Conversations with ethanol industry analysts suggest the total cost could be as much as half of the value of the 45Q credits in some cases. But, even with this level of cost, the revenue potential from the credits is still very attractive to most ethanol producers. ImplicationsThere is considerable interest at the present time in the potential for ethanol plants to lower their carbon footprint by sequestering CO2 that is generated by the ethanol production process. Sequestration projects have been spurred by incentives included in the Inflation Reduction Act (IRA) passed by the U.S. Congress in 2022 and signed into law by President Biden. We estimate total CO2 production of U.S. ethanol plants over 2015 through 2023 and find that it varies from a low of 42.4 million tons to a high of 48.9 million tons. These totals represent slightly less than one percent of total U.S. CO2 equivalent emissions, which helps put into perspective the large size of CO2 production from the relatively small number of ethanol plants operating in the U.S. Given the large CO2 production of ethanol plants, it is not surprising that the maximum possible benefit from tax credits for sequestration in the IRA is also large. We estimate the maximum potential revenue to be $3.75 billion per year, which would more than likely double the after-tax income of the U.S. ethanol industry. This is a very large potential impact by any reasonable standard, even after considering costs that may be as much as half of the credit value. References
Douglas, Leah. ōU.S. Ethanol Industry Banks on
Carbon Capture to Solve Emissions Problem.ö Reuters, March
11, 2022.
https://www.reuters.com/business/sustainable-business/us-ethanol-industry-banks-carbon-capture-solve-emissions-problem-2022-03-11/
Irwin, S. ōAnother Strong Year for Ethanol Production Profits in 2023.ö farmdoc daily (14):29, Department of Agricultural and Consumer Economics, University of Illinois at Urbana-Champaign, February 12, 2024. Irwin, S. ōTrends in the Operational Efficiency of the U.S. Ethanol Industry: 2023 Update.ö farmdoc daily (14):28, Department of Agricultural and Consumer Economics, University of Illinois at Urbana-Champaign, February 9, 2024. Jones, A.C., and D.J. Maples. ōThe Section 45Q Tax Credit for Sequestration.ö In Focus, Congressional Research Service, August 25, 2023. https://crsreports.congress.gov/product/pdf/IF/IF11455/1 Mosier, N.S., and K. Ileleji. ōHow Fuel Ethanol is Made from Corn.ö BioEnergy: Fueling America Through Renewable Resources, Purdue Extension, ID-328, December 2006. https://www.extension.purdue.edu/extmedia/id/id-328.pdf Sanchez, D.L., N. Johnson, S.T. McCoy, P.A. Turner and K.J. Mach. ōNear-Term Deployment of Carbon Capture and Sequestration from Biorefineries in the United States.ö Proceedings of the National Academies of Science 115(2018):4875-4880. https://www.pnas.org/doi/full/10.1073/pnas.1719695115
Green Play AmmoniaÖ, Yielder« NFuel Energy. |