|

October 03, 2023
By
Michael Barnard

Midjourney generated image of world laced with
transmission wires and sparks
Wind turbine repowering project comes
with agreements for landowners
There are about 200 GW of HVDC cables
stretching 58,000 kilometers in operation today, and about 180 GW
planned stretching about 45,000 kilometers in planning and
construction.
One of the big levers for decarbonizing our
global energy is by connecting continent-scale grids with high-voltage
direct current transmission (HVDC). Weĺve been doing a lot of that
already, but a lot more is planned. There are about 200 GW of HVDC
cables stretching 58,000 kilometers in operation today, and about 180
GW planned stretching about 45,000 kilometers in planning and
construction. The large majority of whatĺs in operation is in China,
of course.
Letĺs start with the why. As delayers love to say, the wind doesnĺt
blow all the time and the sun doesnĺt shine all the time. But go
north, south, east, and west a few hundred or a couple of thousand
kilometers, and the weather is completely different. Weĺll be
overbuilding renewables in the best places and connecting them to the
highest demand centers like major cities, ports and industrial sites.
The sun may not shine brightly during peak demand periods of the late
afternoon and early evening, but itĺs shining brightly a couple of
time zones or more to the west.
But traditional transmission using high-voltage alternating current
(HVAC) loses a lot of energy over longer distances, and a lot more if
you have to go underwater or underground with the cables. HVDC loses a
lot less energy over great distance, underwater, and underground,
about 3% for every 1,000 kilometers. Thatĺs the most efficient
mechanism for transmitting energy weĺve discovered.
Itĺs so effective and so efficient that itĺs hard to keep up with all
of the projects. Enter RTE International, a consultancy and
engineering company whose activities cover all areas of electricity
transmission. They keep track, as best as they are able, of all
existing and planned HVDC projects globally. They publish updates as
part of their monthly HVDC newsletter, something Iĺve been receiving
and digging through for a while now.
A big part of the newsletter are the huge tables of all existing and
planned HVDC projects. Iĺve been looking at it for a while and wishing
I could do some basic analysis on it. After a quick conversation with
the people at RTE responsible, I pushed it through a PDF to
spreadsheet converter, cleaned up the data, made some guesses and
started doing some cross tabs.
Iĺve chosen to simplify some things in the process, and make some
choices about what the data signifies. That means that some things
have become less accurate. For example, the RTE data set includes the
lengths of a specific project that are underground, subsea, or on
overhead lines (OHL), and many projects combine all three for
different portions of the route. Iĺve simplified that a bit, so any
cable with a subsea segment is represented as all subsea for example.
Itĺs imperfect, but Iĺm interested in gross numbers.
Similarly, the RTE data has the number of lines of all different
sizes, and Iĺve chosen to separate that into total power and the
number of lines, making the assumption that future projects with only
the power have only one line. Thatĺs inaccurate Iĺm sure, but the
errors are understood. Similarly, where no power in MW was expressed
or distance in kilometers was listed, I put in guesses. Finally, where
future dates werenĺt listed, I chose 2030 to have some data in the
mix.
All of that data Ĺcleansingĺ means that any errors are most likely
mine. That said, RTEĺs data isnĺt perfect. Iĺm aware of numerous
existing and planned HVDC interconnectors in the ASEAN region, most to
and from Singapore, but they are missing from the data at present.
There is an emerging ASEAN supergrid that Iĺm paying some attention to
which appears to be off of RTEĺs radar. And as I found out while
working on this analysis and writing as I went, it appears to be
missing a lot of data from China.
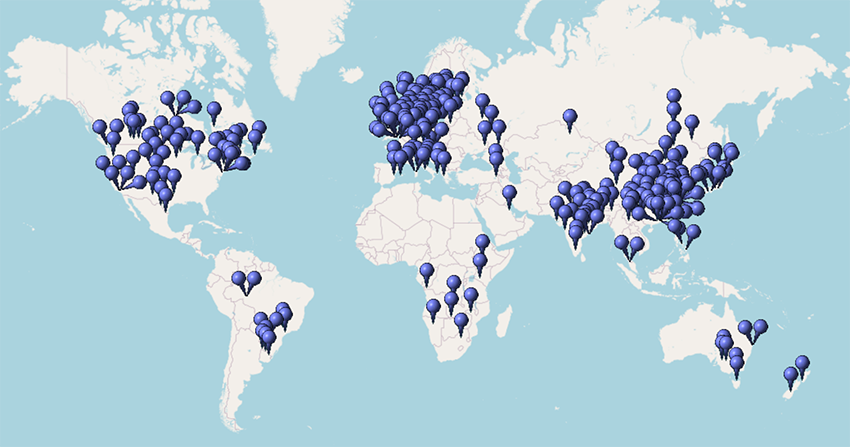
Locations of current, planned and in construction
HVDC projects globally from Open Street Maps
Wikipedia maintains a list of the HVDC
operational projects and some planned projects, and someone kindly
pushed the data into Open Street Maps to create this visualization. It
leaves some questions open. For todayĺs effort, I mostly didnĺt try to
integrate Wikipediaĺs data with RTEĺs and resolve the overlap.
But RTEĺs data did allow me to ask a few questions Iĺd been wondering
about. The current and future GW and kilometers listed in the opening
paragraph, combined with Chinaĺs data set from Wikipedia, was one of
them.
Another question was the breadth question. Remember that the intent of
transmission is to bring electricity from where it happens to be
generated to where it is needed. As such, future projects would
reasonably be expected to have both a longer transmission length and
be more likely to connect countries.
And thatĺs true. Even with my choice to use 100 kilometers as the
length for projects without any length data (all future), the average
length of future projects is about double historical projects Ś 454
kilometers vs 229 kilometers. (The lack of a lot of Chinaĺs
operational data in RTEĺs data cuts those numbers down a lot.) HVDC
projects of the future are running much further than historical
projects, at least outside of China. Somewhat surprisingly, current
projects arenĺt necessarily connecting countries more than historical
projects as a ratio. About a quarter by power of the projects was
historically flowing between countries, and thatĺs true for future
projects as well.
Of course, there is a reason for this. The majority of all operational
projects and a fifth of future HVDC in the world is in China, about
170 GW existing and 27 GW planned or under construction. Chinaĺs a big
country, the third largest in the world by land mass and slightly
larger than number four on the list, the United States. The USA has
about a GW of HVDC today, about 2% of the global total, and a 35 GW
planned per RTE.
I cross-checked against the Wikipedia data set, and found a lot more
Chinese projects than the RTE data has. Wikipedia has 55 HVDC lines in
the country, while RTE only shows 18 between operational and future
projects. All 55 are operational per Wikipedia, which has different
imperfections than RTEĺs data, of course. But assuming that Wikipedia
data is more correct for operational Chinese HVDC, and RTEĺs data is
more accurate for the rest of the world and future projects, the
country has more than the rest of the world combined, which was my
assumption going into this analysis exercise.
Assuming RTE is more right for the rest of the world than it is for
China (a fairly safe assumption), then the total HVDC globally is
about 200 GW totally, with 72% of that inside China, and the total
current length of HVDC is about 58,000 kilometers, with 86% of that
inside China.
Itĺs taken me a long time to find analysts who read Mandarin and
follow Chinaĺs energy progression from the inside by reading the
countryĺs reports in their own language, and Iĺve had conversations
with international experts like Bent Flyvbjerg about the challenges.
No flies on RTE if their China data is less complete. And, of course,
the USA is the country of aspirations, so I suspect less of that
future HVDC will be completed as an average. But it would make sense
for RTEĺs people to cross-check with Wikipedia and reduce the
disparity given that they are pushing their HVDC data set out monthly.
The point of that is that China and the USA having a third of the
planned HVDC power between them means that continent-scale grids are
being built, just inside countries that are the size of continents.
Chinaĺs average operational length is about 1,300 kilometers per
Wikipedia, while its future length of cables is about 1,400 per RTE.
The variance is even more extreme for the USA, with an average of
operational cables of 63 kilometers vs a future project average of 420
kilometers (all RTE numbers).
There were some other things I expected the data to show. HVDC has
been historically used to link grids together. Operational grids have
a rhythm, the beats per second that the current alternates, typically
50 or 60 times a second. HVDC has no rhythm as it doesnĺt alternate.
That makes it a great tool to connect two grids so that they can share
electricity without having to synchronize their beats per second which
are either simply misaligned by a fraction of a second, or have a
different beats per second entirely. Thatĺs referred to as
back-to-back HVDC connections and itĺs usually done at the
geographical point where the grids meet, so the distance of the
linkage is zero.
I expected that operational HVDC systems would have a higher
percentage of back-to-back HVDC connections than future grids, and RTE
data does show this. Historically, about 18% of HVDC operational
systems by power were back-to-back, but in the future only about 3% of
planned systems are back-to-back. As a note, in the past vs future
length assessment above, I removed the zero distance back-to-back
connections.
I also expected more future projects to be subsea, and even with
Chinaĺs massive in-country projects excluded, about 5% more of future
projects are subsea. Thatĺs another indication of connecting countries
as opposed to being inside of them.
HVDC being the new pipeline continues to be supported by this. As we
look around the world, HVDC projects are booming everywhere. The
aluminum that they are made of is the most common element in the
earthĺs crust, and new HVDC factories are being built on multiple
continents. They are moving TWh of renewable electricity across
thousands of kilometers today, and will be carrying vastly more in the
future. Countries which continue to focus on moving molecules for
energy are going to be left behind.
Green Play AmmoniaÖ, Yielder« NFuel Energy.
Spokane, Washington. 99212
509 995 1879
Cell, Pacific Time Zone.
General office:
509-254
6854
4501 East Trent
Ave.
Spokane, WA 99212
|